Select or drop a image or 3D model here to search.
We support JPG, JPEG, PNG, GIF, WEBP, GLB, OBJ, STL, FBX. More formats will be added in the future.
Asset Overview
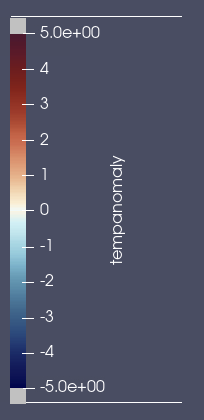
This shows the mean surface air temperature anomalies for the year 2020 as compared to the base period means from 1950-1980. The topographies shown are scaled by a factor of 20 to be more prevalent.
The data comes from a NASA GISS 5 X 5 curvelinear grid dataset with 1200km smoothing. The data was interpolated using the Python package xarray to scale the data by a factor of 64 prior to projecting it onto a polygonal mesh. Paraview was used to render this model.
https://data.giss.nasa.gov/gistemp/
Temperature anomoly colormap (degrees Celsius)