Select or drop a image or 3D model here to search.
We support JPG, JPEG, PNG, GIF, WEBP, GLB, OBJ, STL, FBX. More formats will be added in the future.
Asset Overview
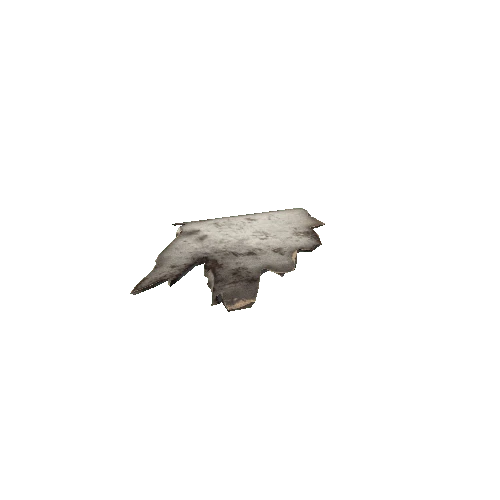
A first attempt to directly overly Bouguer gravity anomaly data on the topography of Connecticut. I'm not entirely convinced I got these lined up correctly, but they should be close.
Green in the gravity data indicates a low/negative anomaly, while red indicates a positive anomaly. If we assume these are solely due to thickness variations of the underlying crust, this suggests there's a significant thinning of the crust on the western side of the central Hartford Basin( crustal rocks having a lower density than mantle rocks, so low anomalies should indicate thicker crust).